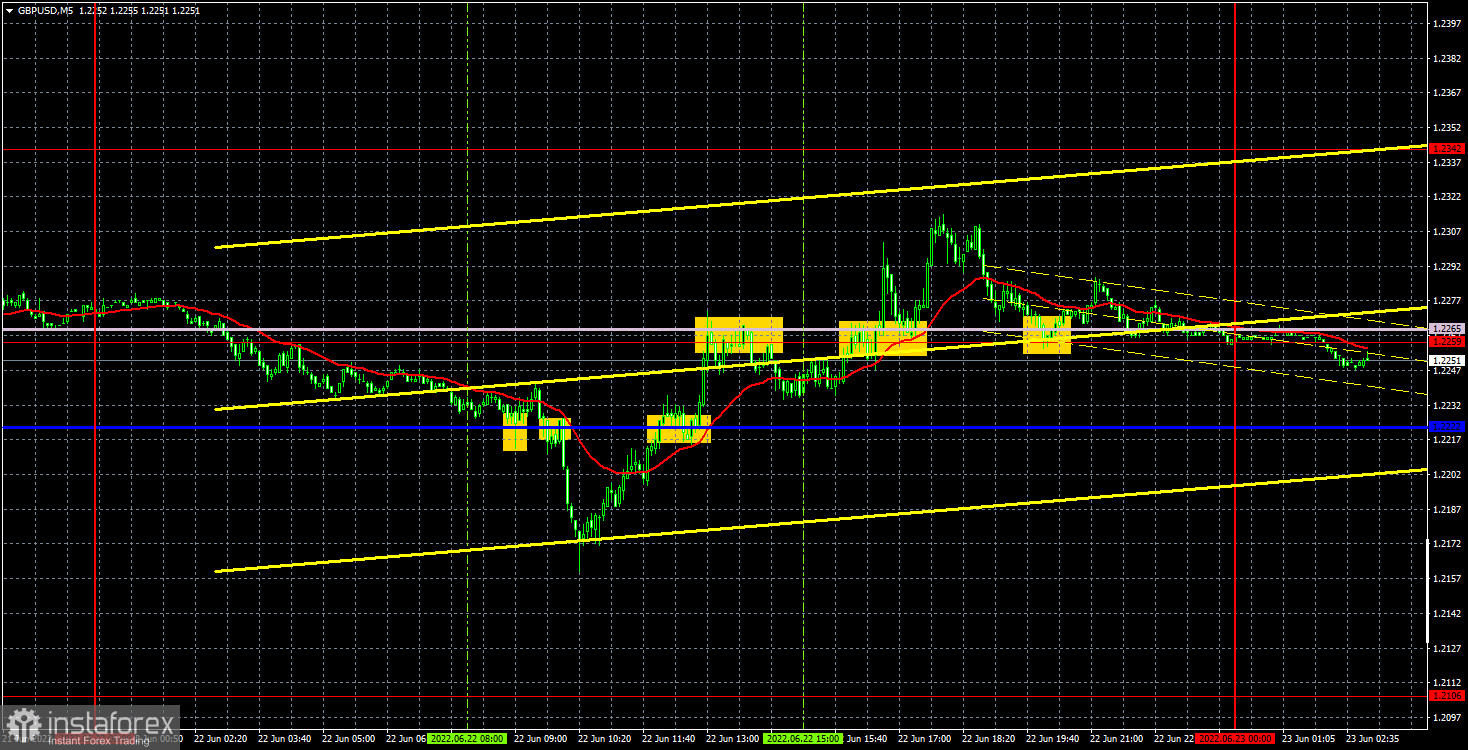
GBP/USD 5M
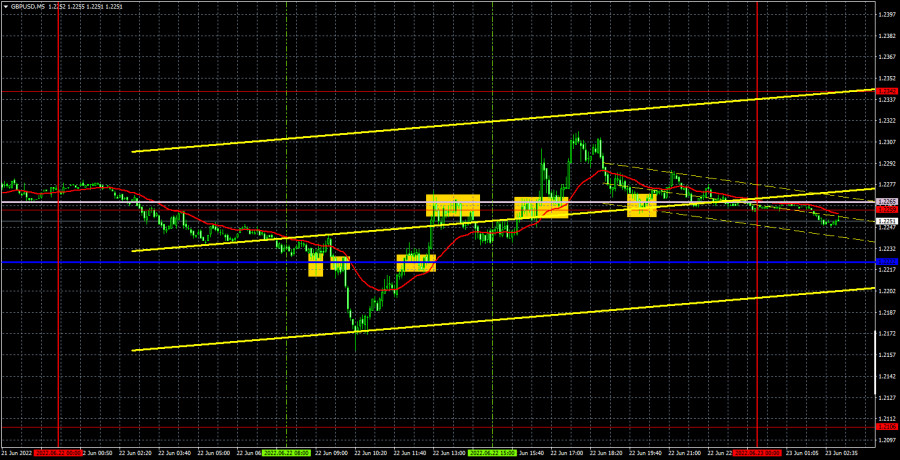
The GBP/USD currency pair also showed an upward movement on Wednesday, but unlike the EUR/USD pair, it traded much more chaotically. The day started with a drop of 120 points. Theoretically, one can try to link such a strong fall with the report on British inflation, which once again rose, ignoring the efforts of the Bank of England. But in fact, the British pound was depreciating, but it should have been growing. However, let's write it off as a not entirely logical reaction of the market. However, the pound even began to grow during the European trading session and by the end of it (that is, in a few hours) offset all the morning and night losses. What's this? Is the market admitting that it initially misinterpreted the inflation report? Further more interesting. Federal Reserve Chairman Jerome Powell's speech began, during which he once again confirmed that the central bank would continue to raise rates in order to overcome inflation. Here the dollar should have shown growth, but instead continued to fall. And by the end of the US trading session, it returned to its original positions. As a result, it is very difficult to call the way the market traded the pair on Wednesday as logical.
The same goes for trading signals. There were several of them and each of them left much to be desired. The first signal turned out to be false, the second - real. The first one should not have been worked out, since the UK inflation report was published at that time. After the second signal, the pair plowed down 45 points, but failed to reach the target level, so Stop Loss worked at breakeven. The third buy signal should not have been worked out, since the first two turned out to be false. The fourth and fifth signals also turned out to be false. A small loss was received on the fourth one, the fifth one should not have been worked out, since at the time of its formation the price had already flown up.
COT report:
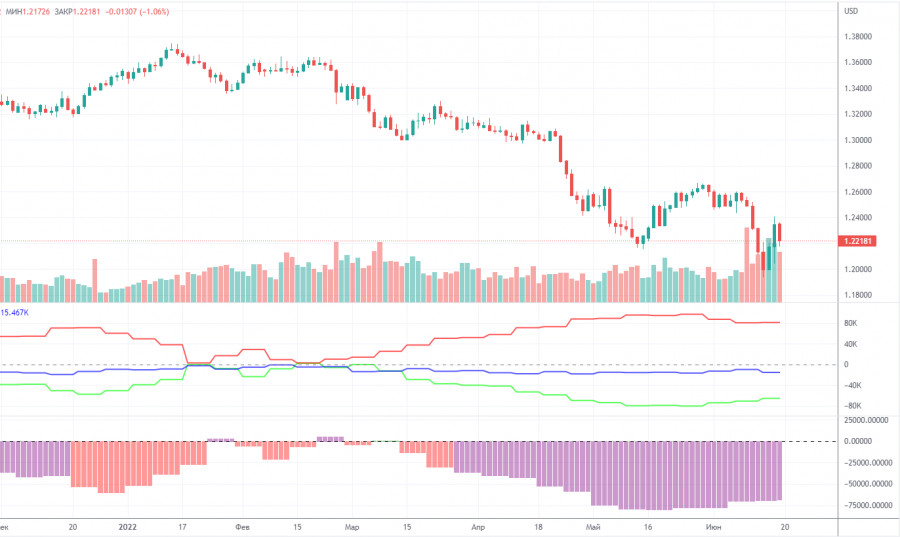
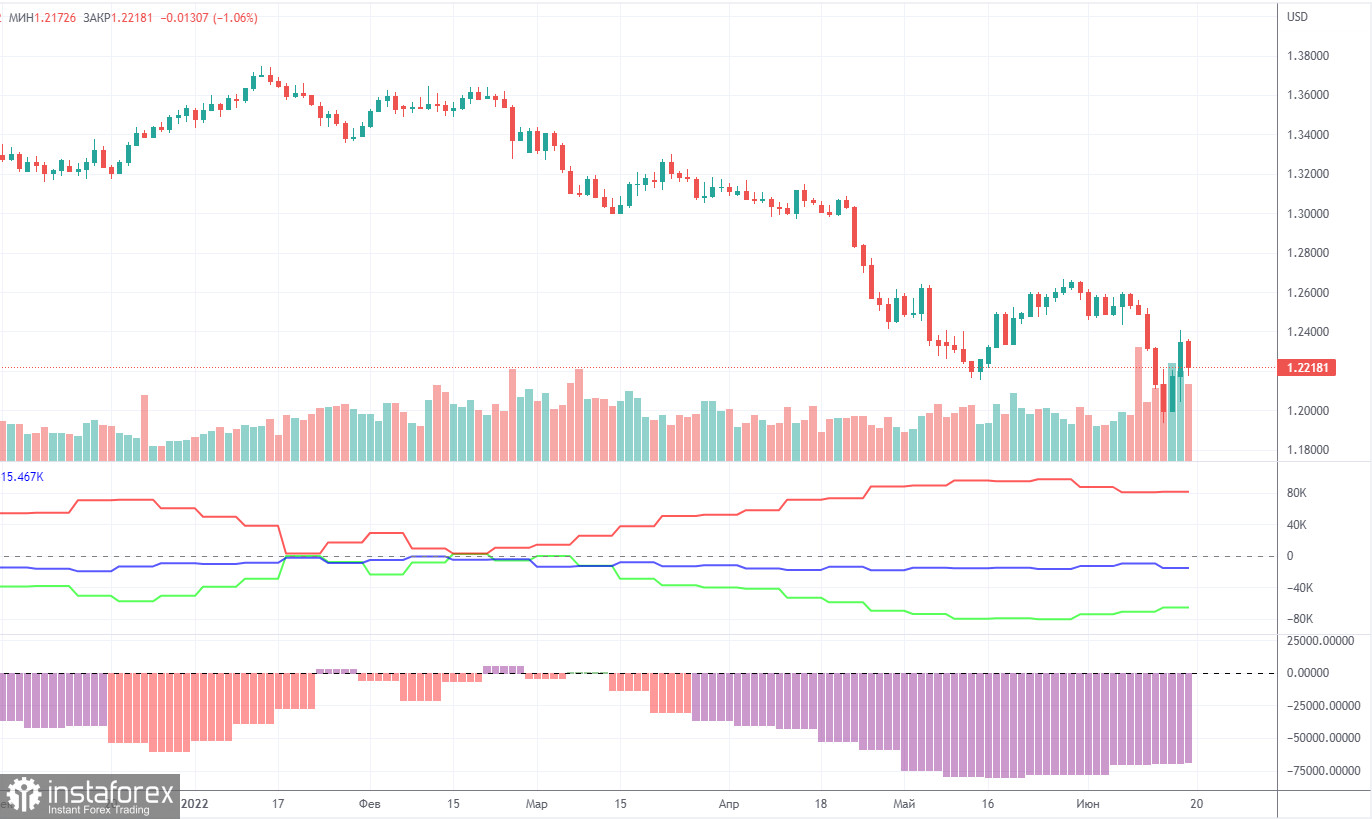
The latest Commitment of Traders (COT) report on the British pound showed insignificant changes. During the week, the non-commercial group closed 5,200 long positions and 10,500 short positions. Thus, the net position of non-commercial traders increased by 5,300. However, the mood of major players still remains "pronounced bearish". And the pound, despite the growth of the net position, still continues to fall. The net position has been falling for three months, which is perfectly visualized by the green line of the first indicator in the chart above or the histogram of the second indicator. Therefore, two or three insignificant increases in this indicator hardly unequivocally indicate the end of the downward trend for the pound. The non-commercial group has a total of 95,000 short positions open and only 29,000 long positions. As you can see, the difference between these numbers is more than three times. We note that in the case of the pound, the COT report data very accurately reflects what is happening in the market: the mood of traders is "very bearish", and the pound has been falling against the US dollar for a long time. In the past few weeks, the pound has been trying to show growth, but even in the chart for this paragraph (daily timeframe), these attempts look pathetic. Since in the case of the pound, the COT report data reflects the real picture of things, we note that a strong divergence of the red and green lines of the first indicator often means the end of the trend. Therefore, formally now we can count on a new upward trend. However, weak geopolitical, fundamental and macroeconomic backgrounds for European currencies still put pressure on them.
We recommend to familiarize yourself with:
Overview of the EUR/USD pair. June 23. And again geopolitics. The European Union continues to put pressure on Russia.
Overview of the GBP/USD pair. June 23. British inflation: neither here nor there.
Forecast and trading signals for EUR/USD on June 23. Detailed analysis of the movement of the pair and trading transactions.
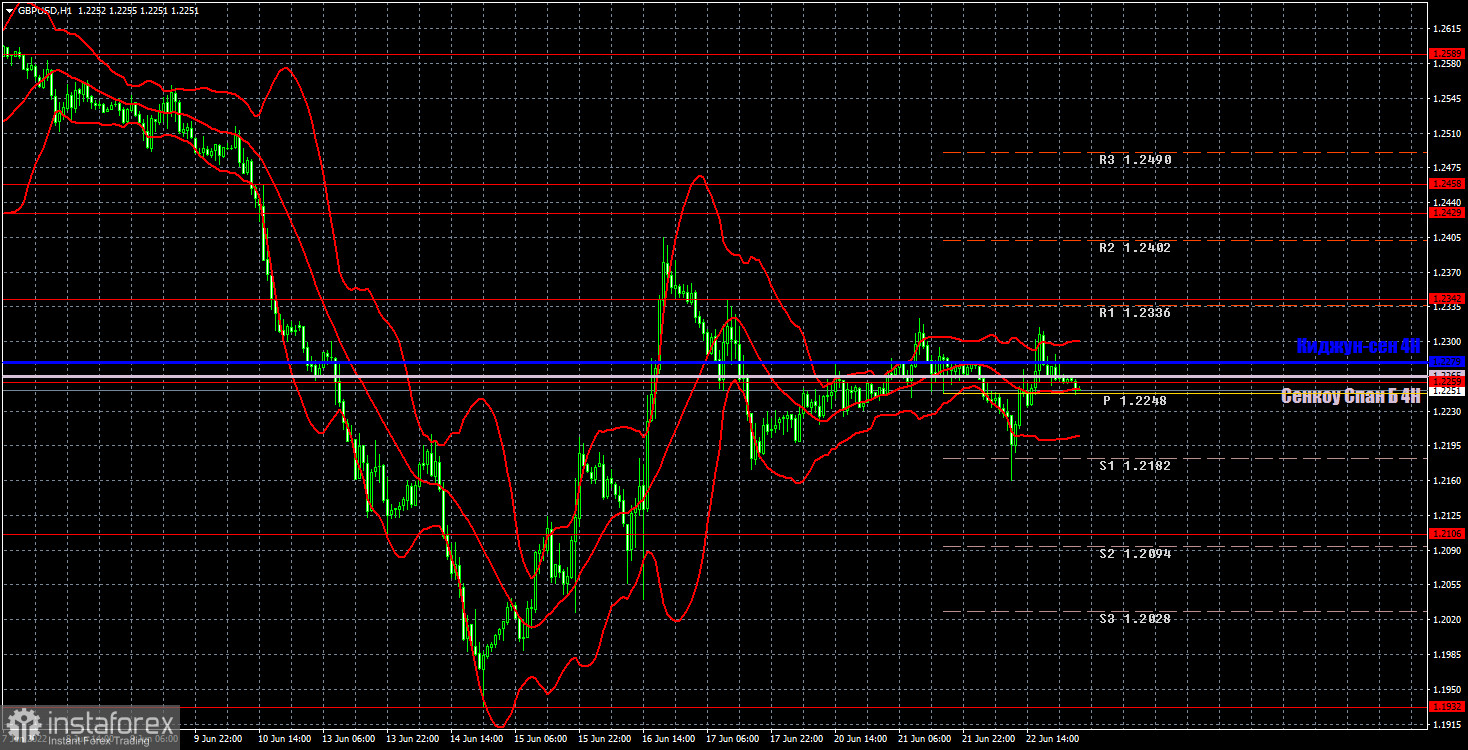
GBP/USD 1H
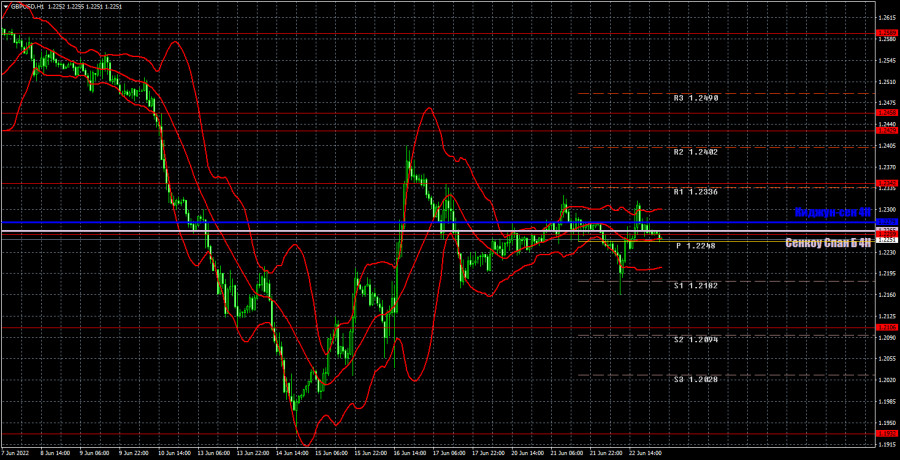
It is clearly seen that the upward trend continues on the hourly timeframe, but the British currency will have to work very hard to update its last local high. There were very chaotic and illogical movements the previous day, and the price could not even update the last "semi-local" high. In general, everything remains very difficult for the pound. Today, we highlight the following important levels: 1.1932, 1.2106, 1.2259, 1.2342, 1.2429, 1.2458, 1.2589. The Senkou Span B (1.2265) and Kijun-sen (1.2279) lines can also be sources of signals. Signals can be "rebounds" and "breakthroughs" of these levels and lines. The Stop Loss level is recommended to be set to breakeven when the price passes in the right direction by 20 points. Ichimoku indicator lines can move during the day, which should be taken into account when determining trading signals. The chart also contains support and resistance levels that can be used to take profits on trades. The US and the UK are set to publish indexes of business activity in the services and manufacturing sectors. Not the most important reports at the moment. Powell's second speech in Congress is also unlikely to cause a logical reaction, but the pair may continue to move volatilely.
Explanations for the chart:
Support and Resistance Levels are the levels that serve as targets when buying or selling the pair. You can place Take Profit near these levels.
Kijun-sen and Senkou Span B lines are lines of the Ichimoku indicator transferred to the hourly timeframe from the 4-hour one.
Support and resistance areas are areas from which the price has repeatedly rebounded off.
Yellow lines are trend lines, trend channels and any other technical patterns.
Indicator 1 on the COT charts is the size of the net position of each category of traders.
Indicator 2 on the COT charts is the size of the net position for the non-commercial group.