empty
 
 
24.01.2023 12:27 PM
Technical analysis of EUR/USD and GBP/USD on January 24, 2023

EUR/USD

This image is no longer relevant

Larger timeframes

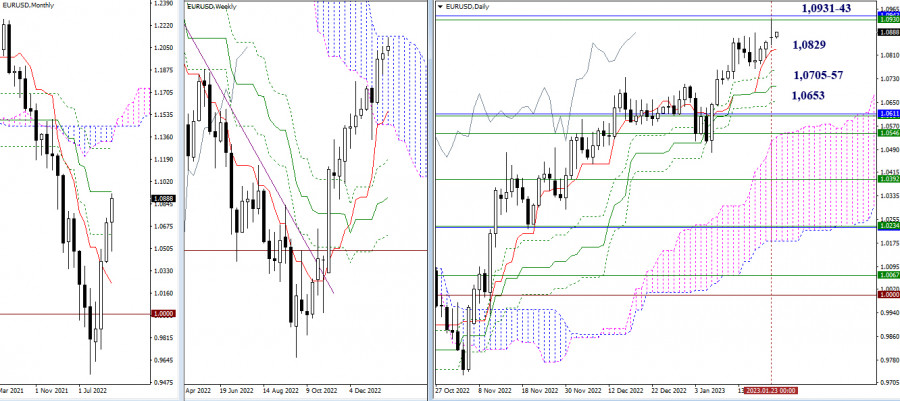
Since Monday, the euro bulls have been pushing EUR/USD up to 1.0931-43, the important resistance zone which is represented by the upper border of a one-week cloud + a one-month medium-term trend. When testing this area, a Doji candlestick has appeared on the daily chart, but the test result will be visible on larger time frames. When the price surpasses 1.0931-43 and settles above, this will open new prospects. If the price is rejected off resistance, traders will shift focus to downward targets. The support levels of the daily Ichimoku cross such as 1.0829 – 1.0757 – 1.0705 – 1.0653, will act as the first targets.

This image is no longer relevant

H4 – H1

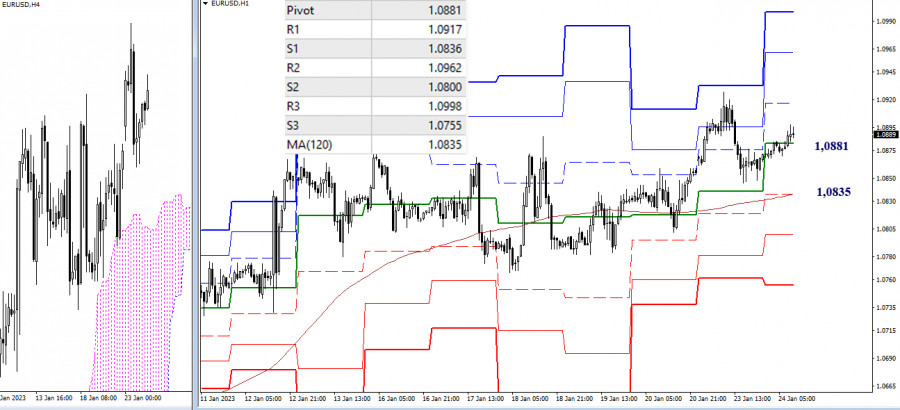
On smaller time frames, despite the ongoing decline, the bulls are still setting the tone because the currency pair stays above the one-week long-term trend line which is located today at 1.0835. Upward intraday targets are seen at the resistance of classic pivot levels of 1.0917 – 1.0962 – 1.0998. A breakout of a one-week long-term trend line at 1.0835 and the price reversal will change the balance of trading forces. Extra downward intraday targets could be found at 1.0800 – 1.0755.

***

GBP/USD

This image is no longer relevant

Larger time frames

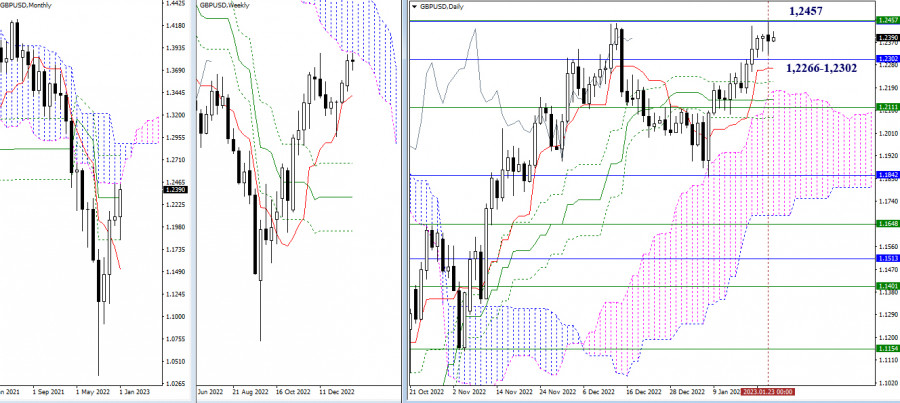
GBP/USD is still testing the important area around 1.2457 which coincides with strong upper borders of the Ichimoku cloud of one-month and one-week time frames. The test result will serve as the key to a further price move. A breakout of this area will reinforce the bullish outlook. A rejection off this area will cement the bearish sentiment. The nearest support levels are seen at 1.2266 – 1.2303 (the intraday short-term trend line + one-month medium-term trend line).

This image is no longer relevant

H4 – H1

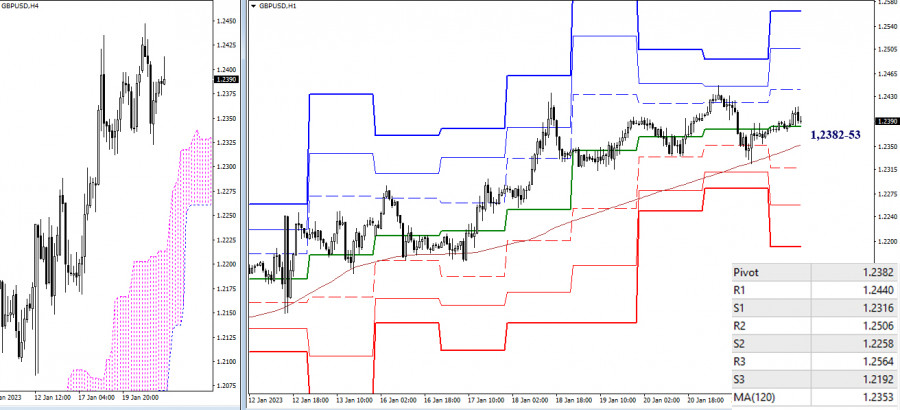
Starting yesterday, GBP/USD has been testing the key levels of smaller time frames. Today, these key levels are seen at 1.2382-53 (the central pivot level + one-week long-term trend line). While the pair is trading above the key levels, the bulls are holding the upper hand. Upward intraday targets are determined today at 1.2440 – 1.2506 – 1.2564 which match the resistance of classic pivot levels. Once the price settles below and reverses its trajectory, the bears will take the lead. Downward targets could be found at support of classic pivot levels such as 1.2316 – 1.2258 – 1.2192.

***

This technical analysis is based on the following ideas:

Larger timeframes - Ichimoku Kinko Hyo (9.26.52) + Fibo Kijun levels

H1 – classic pivot points + 120-period Moving Avarage (weekly long-term trendline)

Evangelos Poulakis,
الخبير التحليلي لدى شركة إنستافوركس
© 2007-2024
كسب عائد من تغيرات أسعار العملات المشفرة مع إنستافوركس.
قم بتحميل منصة التداول ميتاتريدر 4 وافتح أول صفقة.
  • Grand Choice
    Contest by
    InstaForex
    InstaForex always strives to help you
    fulfill your biggest dreams.
    انضم إلى المسابقة
  • إيداع الحظ
    قم بإيداع 3,000 دولار في حسابك واحصل على $1,000 وأكثر من ذالك!
    في أبريل نحن نقدم باليانصيب $1,000 ضمن حملة إيداع الحظ!
    احصل على فرصة للفوز من خلال إيداع 3,000 دولار في حساب تداول. بعد أن استوفيت هذا الشرط، تصبح مشاركًا في الحملة.
    انضم إلى المسابقة
  • تداول بحكمة، اربح جهازا
    قم بتعبئة حسابك بمبلغ لا يقل عن 500 دولار ، واشترك في المسابقة ، واحصل على فرصة للفوز بأجهزة الجوال.
    انضم إلى المسابقة
  • بونص 100٪
    فرصتك الفريدة للحصول على بونص 100٪ على إيداعك
    احصل على بونص
  • بونص 55٪
    تقدم بطلب للحصول على بونص 55٪ على كل إيداع
    احصل على بونص
  • بونص 30٪
    احصل على بونص 30٪ في كل مرة تقوم فيها بتعبئة حسابك
    احصل على بونص

المقالات الموصى بها

لا تستطيع التحدث الآن؟
اطرح سؤالك في الدردشة.
Widget callback