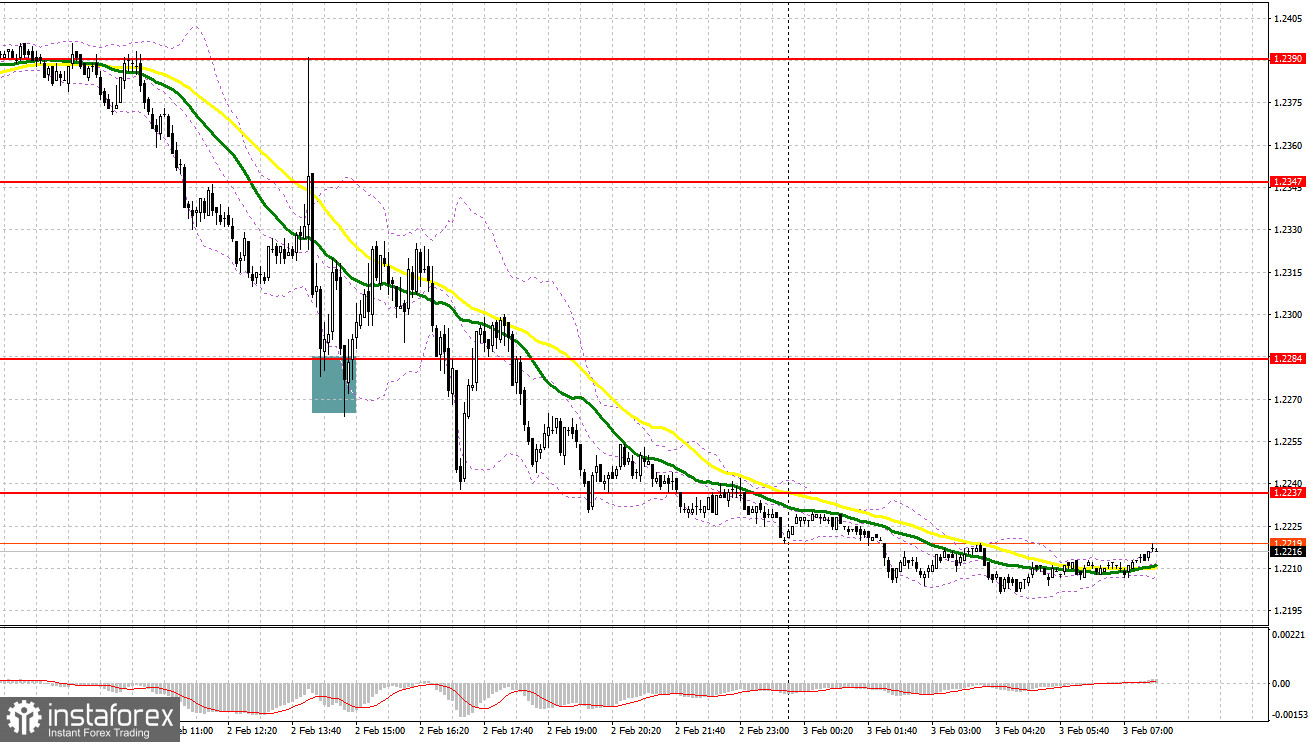
Yesterday GBP/USD formed a few signals for the market entry. Let's analyze the 5-minute chart and revise our trading plan. In the previous article, I referred to the level of 1.2347 and recommended making trading decisions with this level in focus. A decline to 1.2347 happened without a false breakout. So, we didn't receive a signal for opening long positions. In the second half of the day, the Bank of England raised the key interest rate. However, the market responded with a down push which enabled a false breakout at 1.2284 and buy signals. The price climbed by almost 40 pips and later again came under bearish pressure.
What is needed to open long positions on GBP/USD
Today the pound sterling could extend its weakness because analysts warn of poor services and composite PMIs for the UK. A drop in these metrics would prove once again that the Bank of England chose the right approach to further monetary policy. The central bank is expected to scale down the size of further rate hikes.
A speech of Monetary Policy Committee member Huw Pill today also could trigger a large sell-off of the sterling. In case GBP/USD falls, only a false breakout at 1.2194 as I figured out above will allow us to reckon a break to 1.2239, the closing level yesterday. In case the pair settles and tests this level downward and in case the UK PMIs are better-than-expected today which will hardly happen, I will bet on a spike to the high of 1.2284 where moving averages are passing, thus capping the price upside potential. If the instrument breaks above this level, this price action will open the door to a higher level of 1.2332, but only on the condition of too weak US nonfarm payrolls which will be released in the second half of the day.
I'm going to fix profits at that level. If the bulls fail to fulfil their task and lose control over 1.2194, GBP/USD will come under selling pressure. This will encourage a new bearish trend. I would advise you not to rush into buying the pair but to enter the market with long positions near the next resistance at 1.2093, bearing in mind a 30-35-pip intraday correction.
What is needed to open short positions on GBP/USD
The bears are already holding the upper hand. Today there are enough excuses to push the sterling down. The major task for the bears is to assert themselves at about 1.2239. A false breakout at that level will be enough to receive a sell signal, relying on a new and more active down move to 1.2194. A breakout and the opposite test of this level upward will invite more sellers and will generate a sell signal during a decline to 1.2152. The test of this level will open the door for a new downtrend. The most distant target is defined at 1.2092, but it could be hit only in case of too poor US nonfarm payrolls. I'm going to fix a profit there.
In case GBP/USD grows and the bears lack activity at 1.2239, the bulls will get a second wind. In this case, only a false breakout at the next resistance of 1.2282 will create the following market entry point with short positions. Besides, moving averages are passing at about the resistance of 1.2284. If case the bears are sluggish there. I'm going to sell GBP/USD immediately from the high of 1.2332, bearing in mind a 30-35-pip intraday correction.
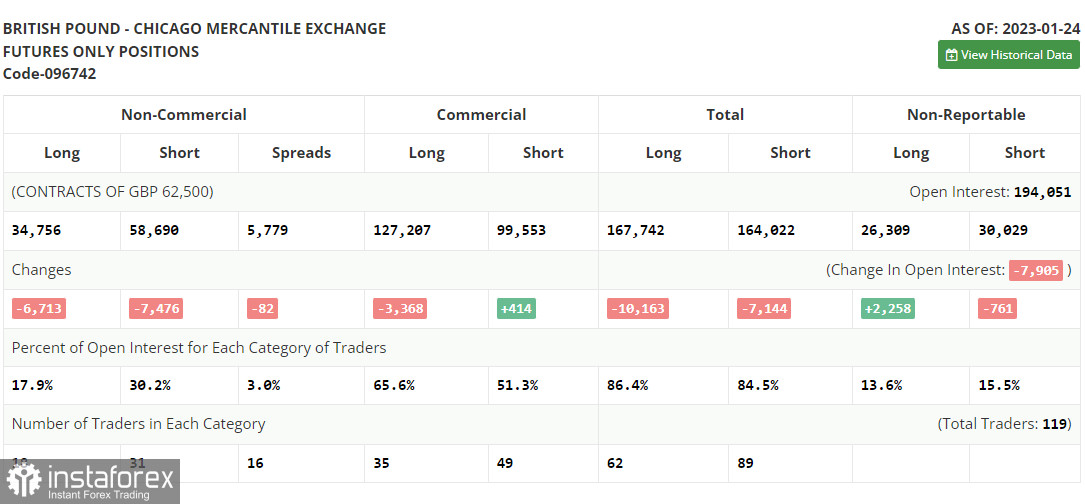
In the COT (Commitment of Traders) report for January 24, there was a sharp decline in both long and short positions. However, the current contraction has been within acceptable limits, especially as the UK government is currently dealing with nationwide strikes and demands for higher wages. At the same time, the monetary authorities are trying to achieve a steady decline in inflation. But for now, all these developments are taking a back seat. This week, financial markets are alert to the policy meetings of the Federal Reserve anticipating dovish signs and the Bank of England, which will most likely maintain its hawkish rhetoric and will raise the interest rate by another 0.5%.
This will all have a positive effect on the British pound, so I will bet on its further strengthening, unless, of course, anything extraordinary happens. The latest COT report states that short non-commercial positions decreased by 7,476 to 58,690, while long non-commercial positions fell by 6,713 to 34,756. As a result, the negative value of the non-commercial net position slipped to -23,934 from -24,697 a week earlier. Minor changes like this don't have much of an impact on the balance of trading forces, so we'll continue to keep a close eye on UK economic performance and the Bank of England's decision. GBP/USD closed last week higher at 1.2350 against 1.2290 in the previous week.
Indicators' signals:
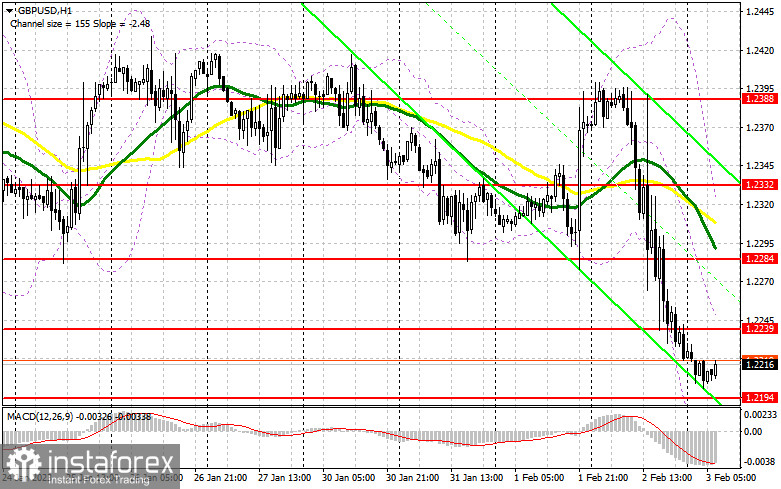
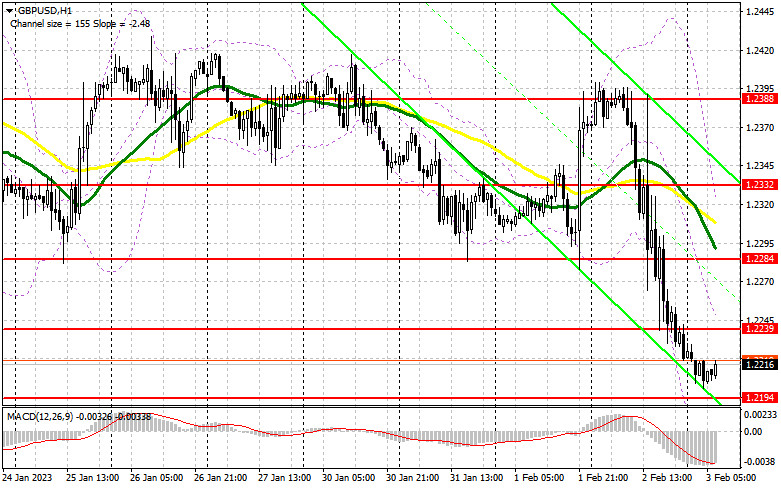
The currency pair is trading below the 30 and 50 daily moving averages. It indicates further weakness in GBP/USD.
Moving averages
Note: The period and levels of moving averages are considered by the author on the 1-hour chart and differ from the general definition of the classic daily moving averages on the daily chart.
Bollinger Bands
If GBP/USD goes up, the indicator's upper border at 1.2320 will serve as support. Alternatively, if the currency pair drops, the lower border at about 1.2170 will act as support.
Description of indicators
- Moving average (moving average, determines the current trend by smoothing out volatility and noise). Period 50. It is marked yellow on the chart.
- Moving average (moving average, determines the current trend by smoothing out volatility and noise). Period 30. It is marked green on the chart.
- MACD indicator (Moving Average Convergence/Divergence — convergence/divergence of moving averages) Quick EMA period 12. Slow EMA period to 26. SMA period 9
- Bollinger Bands (Bollinger Bands). Period 20
- Non-commercial speculative traders, such as individual traders, hedge funds, and large institutions that use the futures market for speculative purposes and meet certain requirements.
- Long non-commercial positions represent the total long open position of non-commercial traders.
- Short non-commercial positions represent the total short open position of non-commercial traders.
- Total non-commercial net position is the difference between short and long positions of non-commercial traders.