Analysis of GBP/USD 5M
On Wednesday, GBP/USD showed very weak volatility, but by the end of the day, it clearly wanted to resume its upward movement. As we have previously mentioned, it is logical for the pair to go through a correction, and this phase has not yet ended because it has only been a couple of days. The British pound received strong support the day before yesterday in the form of decent UK PMI data and poor ones in the US. On Wednesday, the pound had no such thing, but the pair may continue to correct higher for technical reasons. Looking at the long-term perspective, we anticipate a prolonged decline in the British pound, as before.
As long as the price remains below the Senkou Span B line, the downward trend persists. Thus, the pair may rise by another 100 pips before we can expect the correction to end. This week, the macroeconomic and fundamental backgrounds are weak, but it is known that most representatives of the Federal Reserve are looking towards the end of the year regarding a key rate cut. At the same time, the market expects the Bank of England to ease its policy as early as this summer. There's a high chance that the BoE will lower its rate before the Fed. This, in turn, should support the dollar.
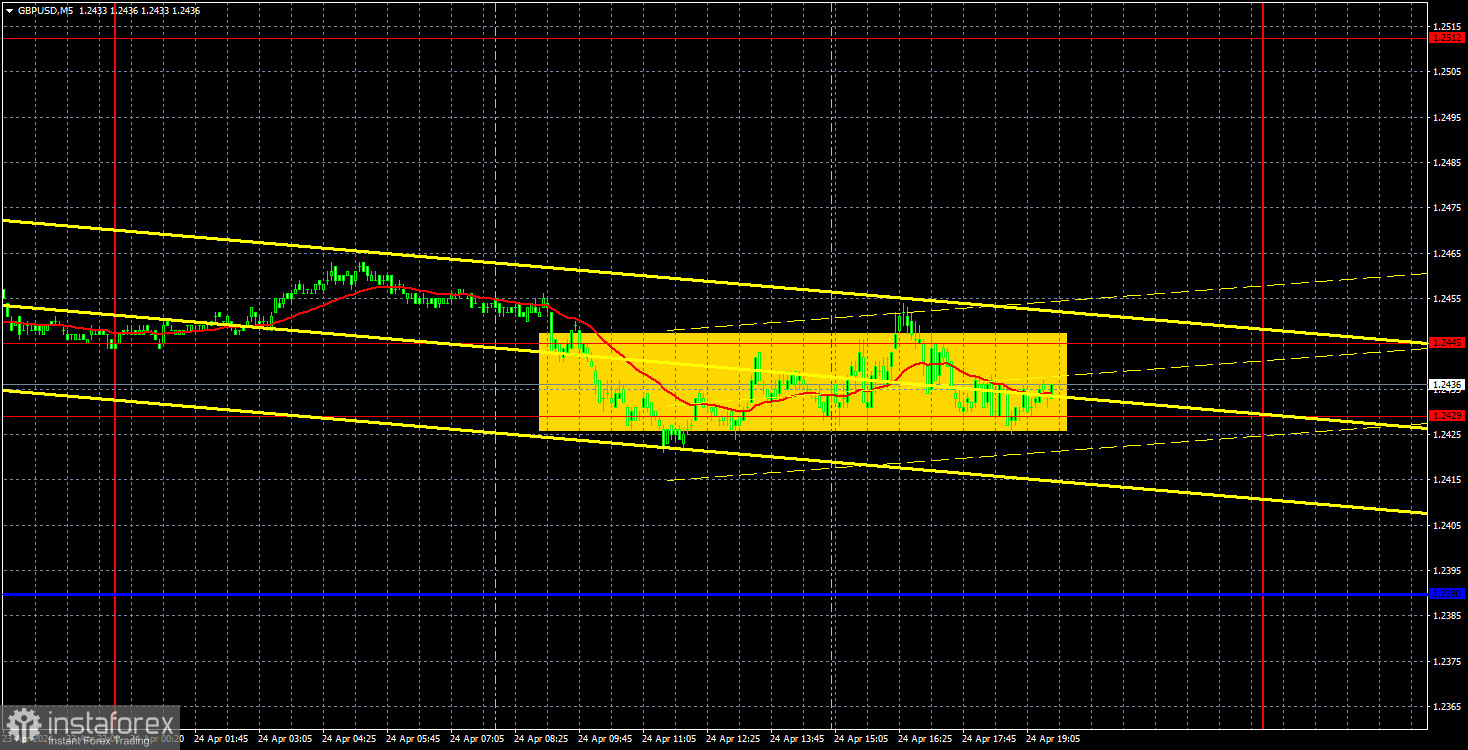
There were no trading signals on the 5-minute timeframe. At the beginning of the European trading session, the pair fell into the 1.2429-1.2445 range and spent almost the entire day in it while volatility was low. Therefore, it made no sense to enter the market; the movements were extremely weak and almost resembled a flat.
COT report:
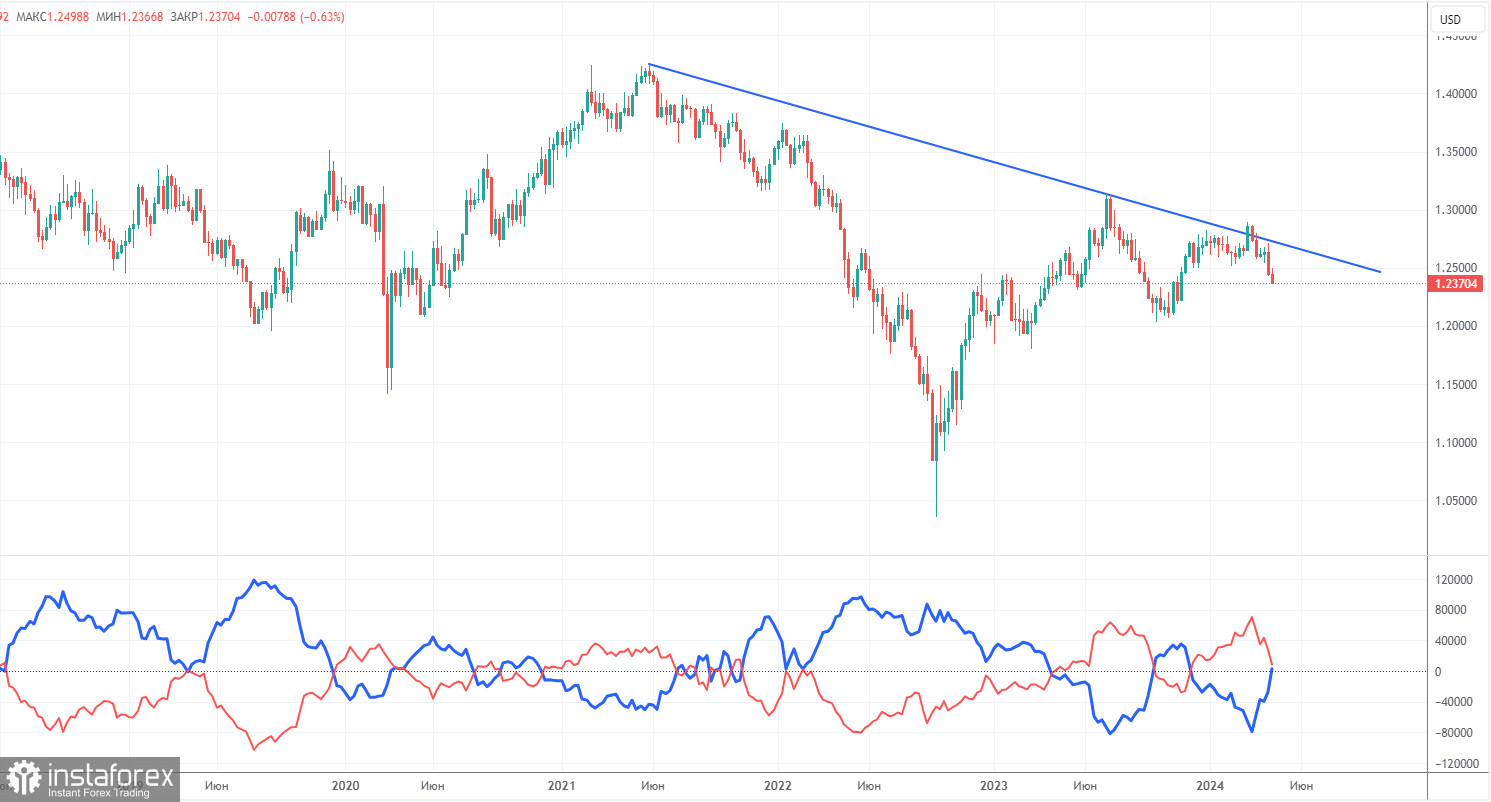
COT reports on the British pound show that the sentiment of commercial traders has frequently changed. The red and blue lines, which represent the net positions of commercial and non-commercial traders, constantly intersect and, in most cases, remain close to the zero mark. According to the latest report on the British pound, the non-commercial group closed 8,200 buy contracts and opened 11,400 short ones. As a result, the net position of non-commercial traders decreased by 19,600 contracts in a week. The fundamental background still does not provide a basis for long-term purchases of the pound sterling, and the currency finally has a real chance to resume the global downward trend. The trend line on the 24-hour TF clearly shows this.
The non-commercial group currently has a total of 71,800 buy contracts and 63,200 sell contracts. The bulls no longer have a significant advantage. Therefore, the pound has a huge potential to fall. We can only hope that inflation in the UK does not accelerate, or that the Bank of England will not intervene.
Analysis of GBP/USD 1H
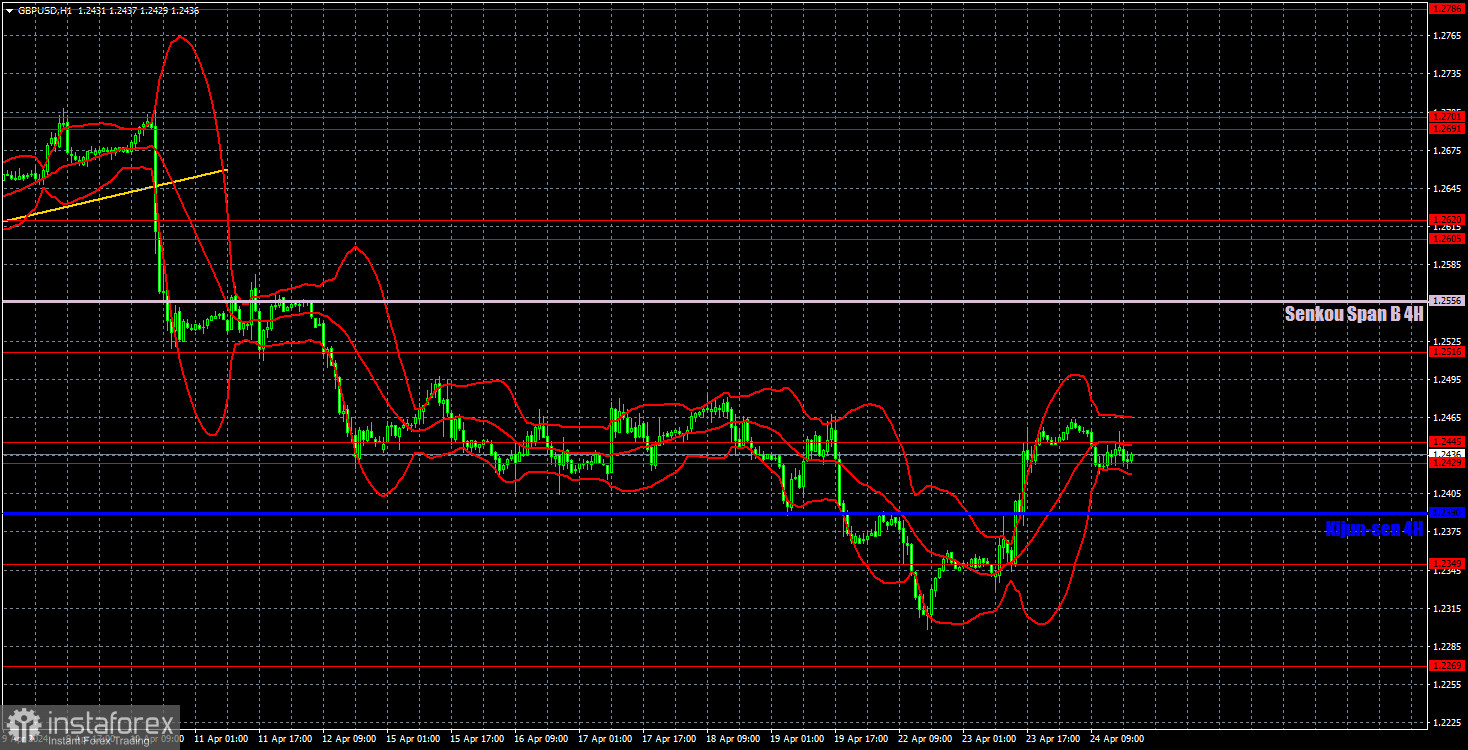
On the 1H chart, GBP/USD has left the sideways channel of 1.25-1.28. Now, the pound should continue forming a downtrend, and the pair has the potential to fall by at least 400-500 pips. The fundamental and macroeconomic background continues to support the dollar, as the US economy is much stronger than the UK, and the Fed keeps pushing back its first rate cut. However, a correction has started, which may continue for some time.
As of April 25, we highlight the following important levels: 1.2215, 1.2269, 1.2349, 1.2429-1.2445, 1.2516, 1.2605-1.2620, 1.2691-1.2701, 1.2786, 1.2863, 1.2981-1.2987. The Senkou Span B line (1.2556) and the Kijun-sen line (1.2390) lines can also serve as sources of signals. Don't forget to set a Stop Loss to breakeven if the price has moved in the intended direction by 20 pips. The Ichimoku indicator lines may move during the day, so this should be taken into account when determining trading signals.
On Thursday, the UK economic calendar is basically empty, while the US will release a relatively important report on GDP, as well as secondary unemployment claims. However, even the GDP report may easily be overlooked if its value does not differ from the forecast.
Description of the chart:
Support and resistance levels are thick red lines near which the trend may end. They do not provide trading signals;
The Kijun-sen and Senkou Span B lines are the lines of the Ichimoku indicator, plotted to the 1H timeframe from the 4H one. They provide trading signals;
Extreme levels are thin red lines from which the price bounced earlier. They provide trading signals;
Yellow lines are trend lines, trend channels, and any other technical patterns;
Indicator 1 on the COT charts is the net position size for each category of traders;