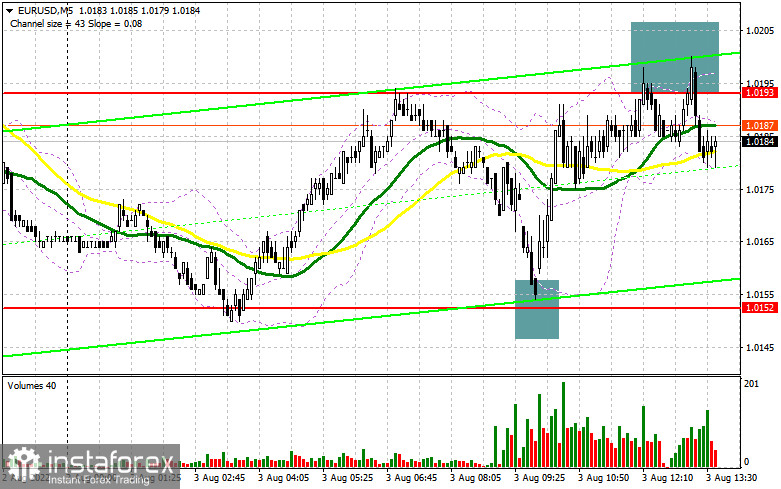
In the morning article, I highlighted the level of 1.0152 and recommended making decisions with this level in focus. Now let's look at the 5-minute chart and try to figure out what actually happened. The euro dropped to 1.0152 which led to a false breakout and a buy signal. However, traders were anticipating a stronger upward correction. The euro/dollar pair rose to 1.0193 following relatively positive eurozone economic reports. However, it failed to advance higher. After a false breakout, a sell signal appeared. However, the bears are in no hurry to regain the upper hand. It indicates the likelihood of a larger correction.
What is needed to open long positions on EUR/USD
For the second half of the day, the technical outlook has not changed. The US is going to unveil the same economic data as the eurozone did – the Services PMI Index and the Composite PMI index. Only positive figures could escalate pressure on the euro. There are no other reasons to sell the EUR/USD pair. Pelosi made a short visit to Taiwan, having done everything that was planned. China has made new warnings that the United States has been ignoring for a long time. Risk assets are gradually rising. If Fed official Patrick T. Harker makes dovish comments on monetary policy, the euro will be able to break above an intraday high. If the pair declines after strong US data, which is very likely, only a false breakout of 1.0152 will give another buy signal. The pair has already rebounded from this level today. If this scenario comes true, the pair may resume an upward movement with the prospect of a jump to the resistance level of 1.0193. A breakout and a downward test of this level will force the bears to close their Stop-Loss orders. There might be an additional buy signal. If so, the pair is likely to approach 1.0233. At this level, the moving averages are passing in negative territory. A distant target will be the 1.0278 level where I recommend locking in profits. If EUR/USD declines and buyers show no activity at 1.0152, the pressure on the pair will increase. It will open the way to 1.0115, which is the lower border of the sideways channel. The best option for opening long positions would be a false breakout of this level. You can buy EUR/USD immediately at a bounce from 1.0082 or a low of 1.0045, keeping in mind an upward intraday correction of 30-35 pips.
What is needed to open short positions on EUR/USD
The bears achieved what they had been planning. They tried to push the pair below 1.0152 and managed to protect 1.0193. However, large sellers do not hurry to return to the market. For this reason, during the American session, the bears are unlikely to push the pair to 1.0193. As long as trading is carried out below this level, a pullback may take place. it is better to sell the pair after a false breakout of the nearest resistance level of 1.0193. It may occur after the release of strong PMI data. If so, the euro will drop to the 1.1052 level. A breakout and consolidation below this level, as well as an upward test, will provide an additional sell signal. It will trigger a decline in the buyers' Stop-Loss orders. The price is likely to hit 1.0115. A drop below this level will open the way to 1.0082 where I recommend closing all short positions. A more distant target will be the 1.0045 level. If EUR/USD rises during the American session and bears show no energy at 1.0193, it is better to postpone short positions to 1.0233. A false breakout of this level will generate a new sell signal. You can sell EUR/USD immediately at a bounce from a monthly high of 1.0278 or a high of 1.0323, keeping in mind a downward intraday correction of 30-35 pips.
COT report
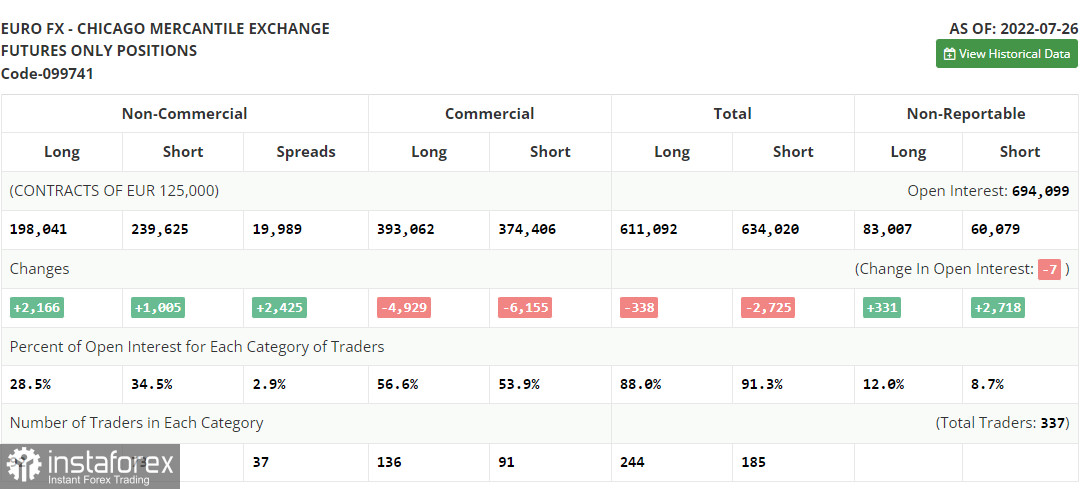
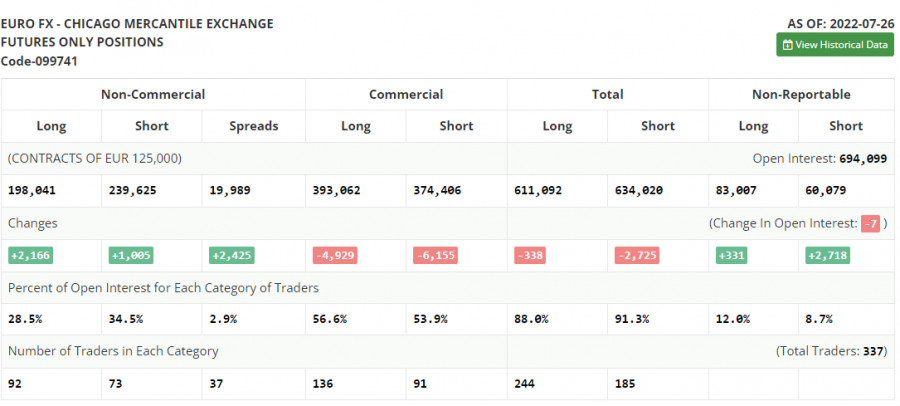
The COT report (Commitment of Traders) for July 26 logged an increase in both short and long positions. However, the number of long ones turned out to be bigger. It indicates the gradual end of the bear market and an attempt to find the bottom after reaching the parity level. The euro advanced amid economic reports for the EU released last week. A slight acceleration in inflation was eclipsed by a sharp growth of the European economy in the second quarter of this year. GDP rose by 4.0% in annual terms. This reading came as a pleasant surprise for economists. It also facilitated the bullish sentiment after the Fed hinted at a possible slowdown in monetary tightening. To this end, the EUR/USD pair is likely to approach new highs. The COT report revealed that the number of long non-commercial positions increased by 2,166, 198,041, while the number of short non-commercial positions jumped by 1,005 239,625. At the end of the week, the total non-commercial net position remained negative. Yet, it rose slightly to -41,584 from -42,745. The weekly closing price dropped to 1.0161 against 1.0278.
Signals of technical indicators
Moving averages
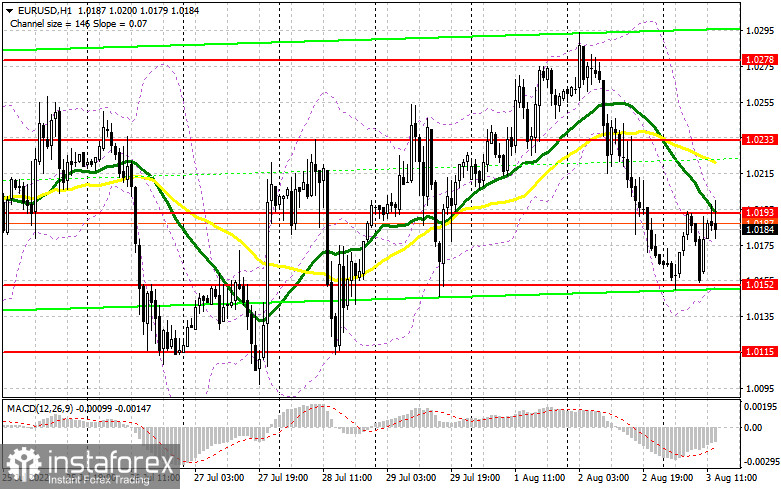
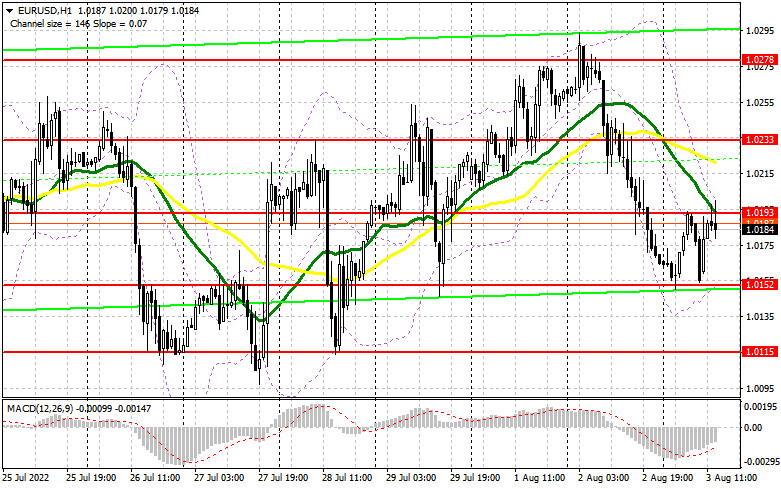
EUR/USD is trading below 30- and 50-period moving averages. It means that the bears don't give up attempts to carry on with a downward correction.Remark. The author is analyzing the period and prices of moving averages on the 1-hour chart. So, it differs from the common definition of classic daily moving averages on the daily chart.
Bollinger Bands
In case of a rise, the upper border of 1.0200 will act as resistance. In case of a decline, the lower border of 1.0152 will act as support.
A breakout of the upper border at about 1.1337 will trigger a new bullish wave of EUR. Alternatively, a breakout of the lower border at about 1.1305 will escalate pressure on EUR/USD.
Definitions of technical indicators
- Moving average recognizes an ongoing trend through leveling out volatility and market noise. A 50-period moving average is plotted yellow on the chart.
- Moving average identifies an ongoing trend through leveling out volatility and market noise. A 30-period moving average is displayed as the green line.
- MACD indicator represents a relationship between two moving averages that is a ratio of Moving Average Convergence/Divergence. The MACD is calculated by subtracting the 26-period Exponential Moving Average (EMA) from the 12-period EMA. A 9-day EMA of the MACD called the "signal line".
- Bollinger Bands is a momentum indicator. The upper and lower bands are typically 2 standard deviations +/- from a 20-day simple moving average.
- Non-commercial traders - speculators such as retail traders, hedge funds, and large institutions who use the futures market for speculative purposes and meet certain requirements.
- Non-commercial long positions represent the total long open position of non-commercial traders.
- Non-commercial short positions represent the total short open position of non-commercial traders.
- The overall non-commercial net position balance is the difference between short and long positions of non-commercial traders.