Analysis of Wednesday's trades:
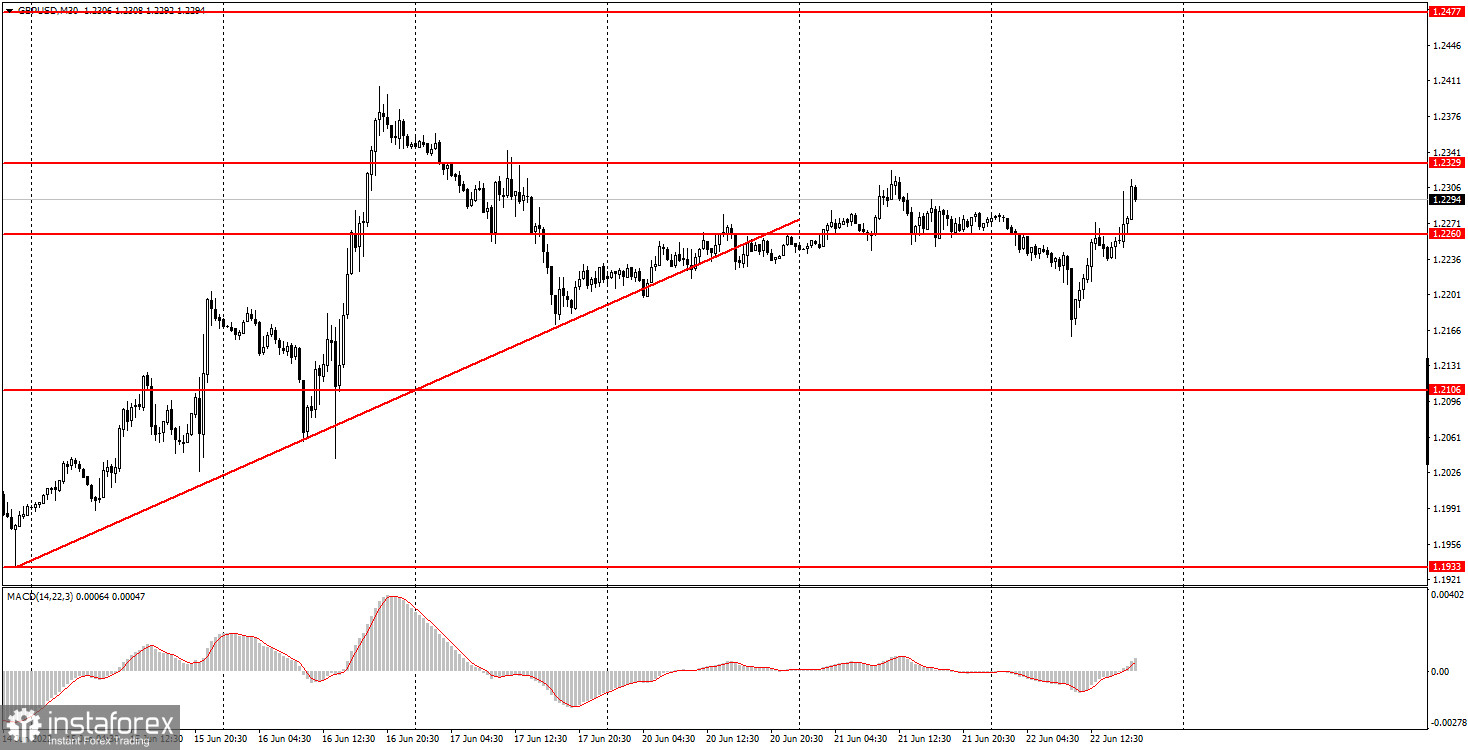
30M chart of GBP/USD.
On Wednesday, GBP/USD showed a movement similar to one of EUR/USD. The price fell in the first half of the day and rose in the second half. The UK saw the release of inflation data, and Fed Chair Powell testified in Congress. Thus, UK inflation increased to 9.1% in May. Although figures came in line with the forecast, a brief sell-off of GBP began. As we know the higher the inflation, the greater the possibility of further monetary tightening by the Bank of England. In other words, the pound should have gone up in the first half of the day and fallen in the second half. Meanwhile, Chair Powell confirmed the Fed's intention to keep fighting record inflation. So, it is possible to say that the pound had an opposite reaction to the data and the chairman's speech. The currency is in an uptrend and may retrace further up for a while. As for its prospects, they remain vague.
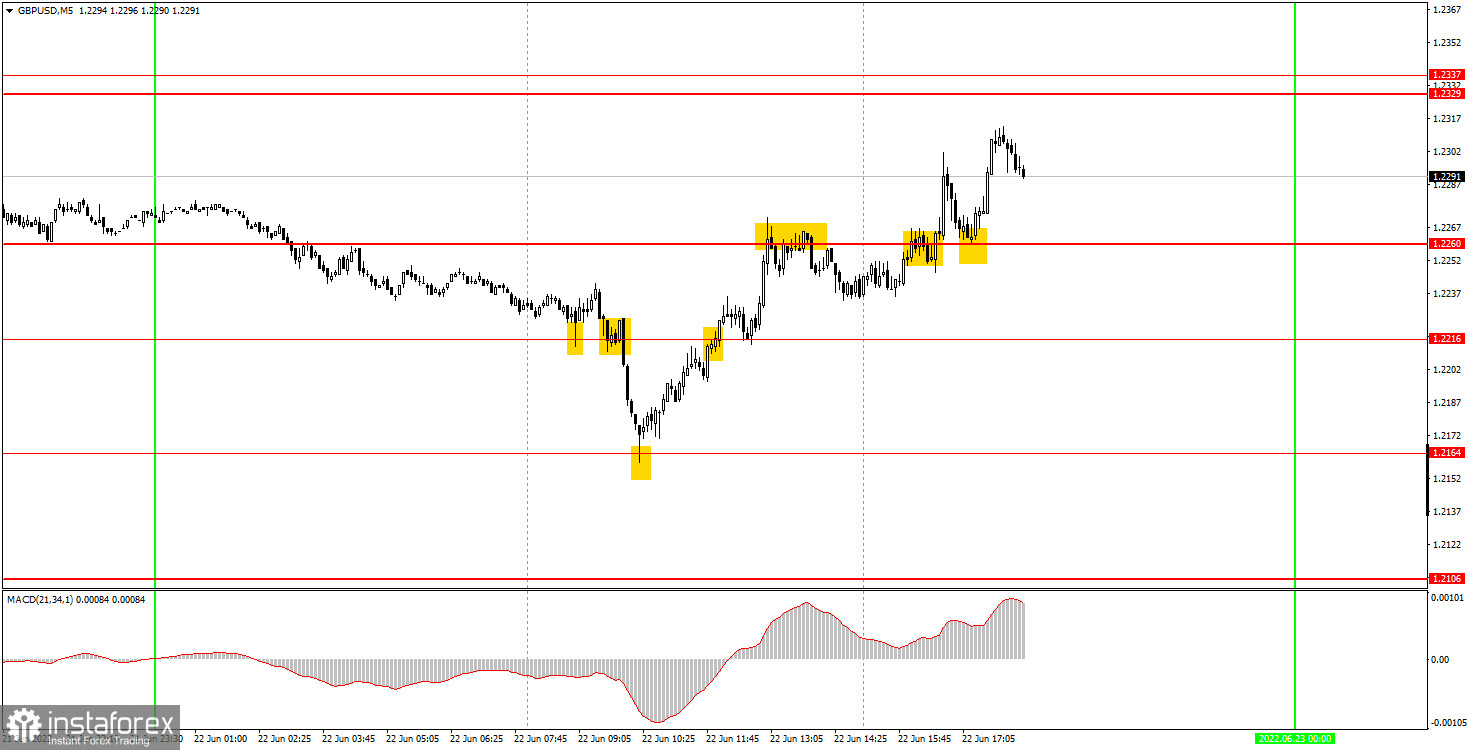
5M chart of GBP/USD
In the M5 time frame, there were both true and false signals made. The pair bounced from 1.2216 producing a false buy signal. It then broke through the mark of 1.2216, creating a true sell signal, fell to 1.2164, and bounced. At the moment of a bounce, it was time to close short positions and open long ones. The pair then broke through 1.2216, rose to 1.2260, and bounced. Thus, it was time to close longs and open shorts. However, that signal turned out to be false, so it was impossible to set a stop-loss order. As a result, it was an unprofitable trade. When the price settled above 1.2260, a buy signal was made. There was no point in going long there because the price was far too high at the moment a signal was created. The quote then bounced from 1.2260, making the last buy signal, which turned out to be profitable. Overall, profit totaled 82 pips.
Trading plan for Thursday:
In the M30 time frame, the pair is in an uptrend but the trend line is no longer relevant. On Wednesday, the pound reacted illogically to important events and reports. Therefore, it is unlikely to extend the uptrend. In the M5 time frame, levels 1.2164, 1.2216, 1.2260, 1.2329-1.2337, 1.2371, and 1.2471-1.2477 stand as targets on Thursday. A stop-loss order should be set at the breakeven point as soon as the price passes 20 pips in the right direction. On Thursday, the UK and the US will see the release of business activity data in the services and manufacturing sectors. The market might react to the results should one or several indicators differ considerably from economists' forecasts. Fed Chair Powell's testimony in Congress will continue on Thursday.
Basic principles of the trading system:
1) The strength of the signal depends on the time period during which the signal was formed (a rebound or a break). The shorter this period, the stronger the signal.
2) If two or more trades were opened at some level following false signals, i.e. those signals that did not lead the price to the Take Profit level or the nearest target levels, then any consequent signals near this level should be ignored.
3) During the flat trend, any currency pair may form a lot of false signals or produce no signals at all. In any case, the flat trend is not the best condition for trading.
4) Trades are opened in the time period between the beginning of the European session and until the middle of the American one when all deals should be closed manually.
5) We can pay attention to the MACD signals in the 30M time frame only if there is good volatility and a definite trend confirmed by a trend line or a trend channel.
6) If two key levels are too close to each other (about 5-15 pips), then this is a support or resistance area.
How to interpret charts:
Support and resistance levels can serve as targets when buying or selling. You can place Take Profit near them.
Red lines are channels or trend lines that display the current trend and show which direction is better to trade.
MACD indicator (14,22,3) is a histogram and a signal line showing when it is better to enter the market when they cross. This indicator is better to be used in combination with trend channels or trend lines.
Important speeches and reports that are always reflected in the economic calendars can greatly influence the movement of a currency pair. Therefore, during such events, it is recommended to trade as carefully as possible or exit the market in order to avoid a sharp price reversal against the previous movement.
Beginner traders should remember that every trade cannot be profitable. The development of a reliable strategy and money management is the key to success in long-term trading.