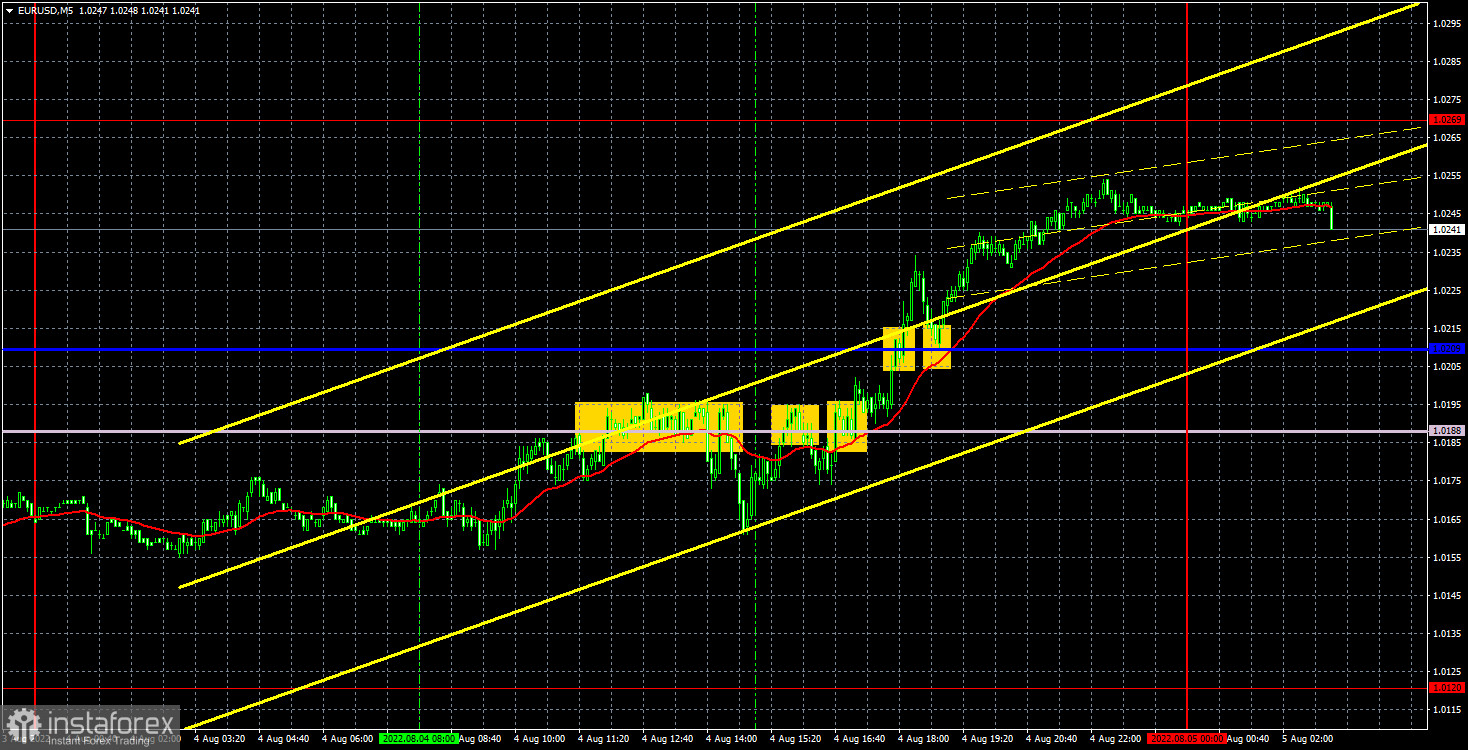
EUR/USD 5M
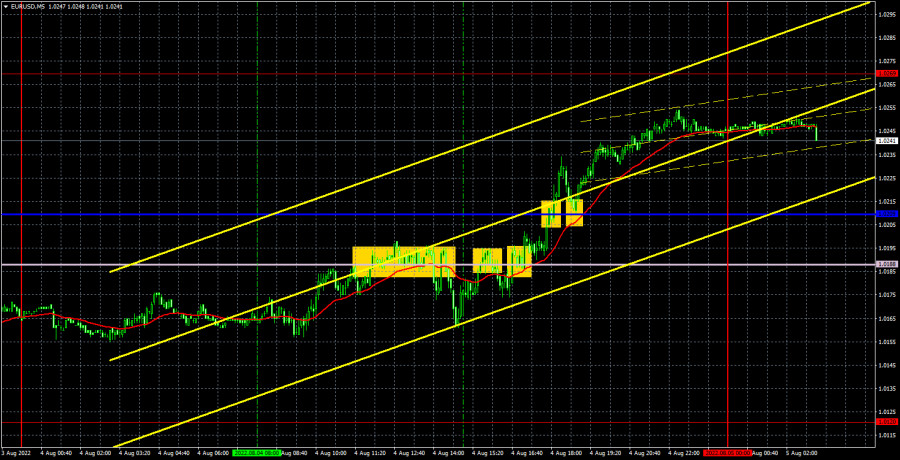
The EUR/USD pair stopped in its fall and began a new round of upward movement on Thursday. Please note that the reversal took place even days earlier near the level of 1.0120, which is the lower boundary of the horizontal channel, which we constantly talk about in recent articles. Thus, following Thursday's results, the price continues to remain inside the 1.0120-1.0269 channel and it is not clear when it will be able to get out of it. Recall that the flat has been persisting for several weeks, and even the Federal Reserve meeting with a 0.75% rate hike could not convince traders to withdraw the pair from it. Ichimoku indicator lines are weak in a flat. No important macroeconomic statistics were published on Thursday either in the US or in the European Union, therefore, from a fundamental point of view, the euro's growth was not justified. But this is how the pair moves in any flat: either up or down. It's just that now our channel is wide enough, so the movements inside it are quite strong, hence the impression that the flat is about to end.
Everything in regards to Thursday's trading signals was bad. As we have already said, the Ichimoku indicator lines are weak in the flat, and yesterday there was not a single sensible signal formed around them. Each time, the pair ignored these lines and it was, in fact, unclear whether it overcame them or rebounded from them. Therefore, traders could try to work out the first two signals near the Senkou Span B line. On the first one, the deal was closed at Stop Loss at breakeven, on the second one, a small loss was received. However, it was offset by a long position on a signal that the critical line had been crossed. In general, the day ended in zero profit.
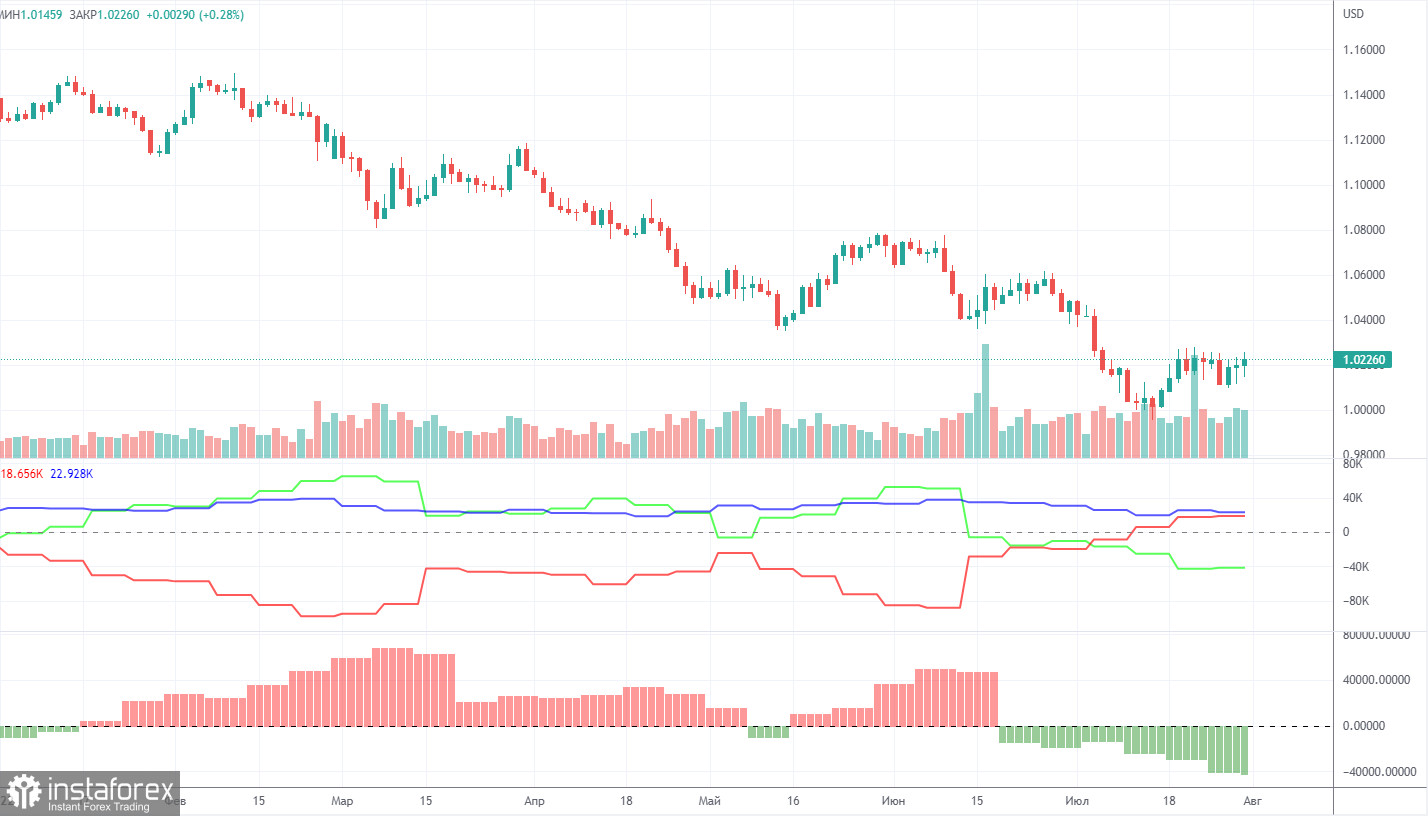
COT report:
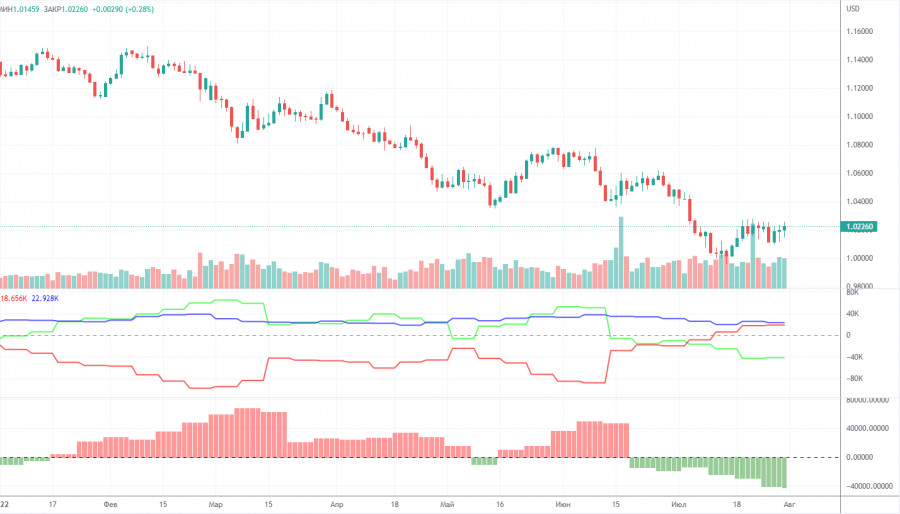
The Commitment of Traders (COT) reports on the euro over the past six months have raised a huge number of questions. The chart above clearly shows that for most of 2022 they showed a blatant bullish mood of commercial players, but at the same time, the euro was falling. The situation has changed at this time, but NOT in favor of the euro. If earlier the mood was bullish, but the euro was falling, now the mood is bearish and... the euro is also falling. Therefore, for the time being, we do not see any grounds for the euro's growth, because the vast majority of factors remain against it. During the reporting week, the number of long positions increased by 2,100, and the number of shorts in the non-commercial group increased by 1,000. Accordingly, the net position increased, but only by 1,000 contracts. The sentiment of the big players remains bearish and has continued to pick up in recent weeks. From our point of view, this fact very eloquently indicates that at this time even commercial traders do not believe in the euro. The number of longs is lower than the number of shorts for non-commercial traders by 41,000. Therefore, we can state that not only the demand for the US dollar remains high, but also the demand for the euro is quite low. This may lead to a new, even greater fall of the euro. In principle, over the past few months or even more, the euro has not been able to show even a tangible correction, not to mention something more. The maximum upward movement was about 400 points.
We recommend to familiarize yourself with:
Overview of the EUR/USD pair. August 5. Only the Nonfarm data remains to survive.
Overview of the GBP/USD pair. August 5. The Bank of England raised the rate by 0.5% and stunned the markets with its forecasts.
Forecast and trading signals for GBP/USD on August 5. Detailed analysis of the movement of the pair and trading transactions.
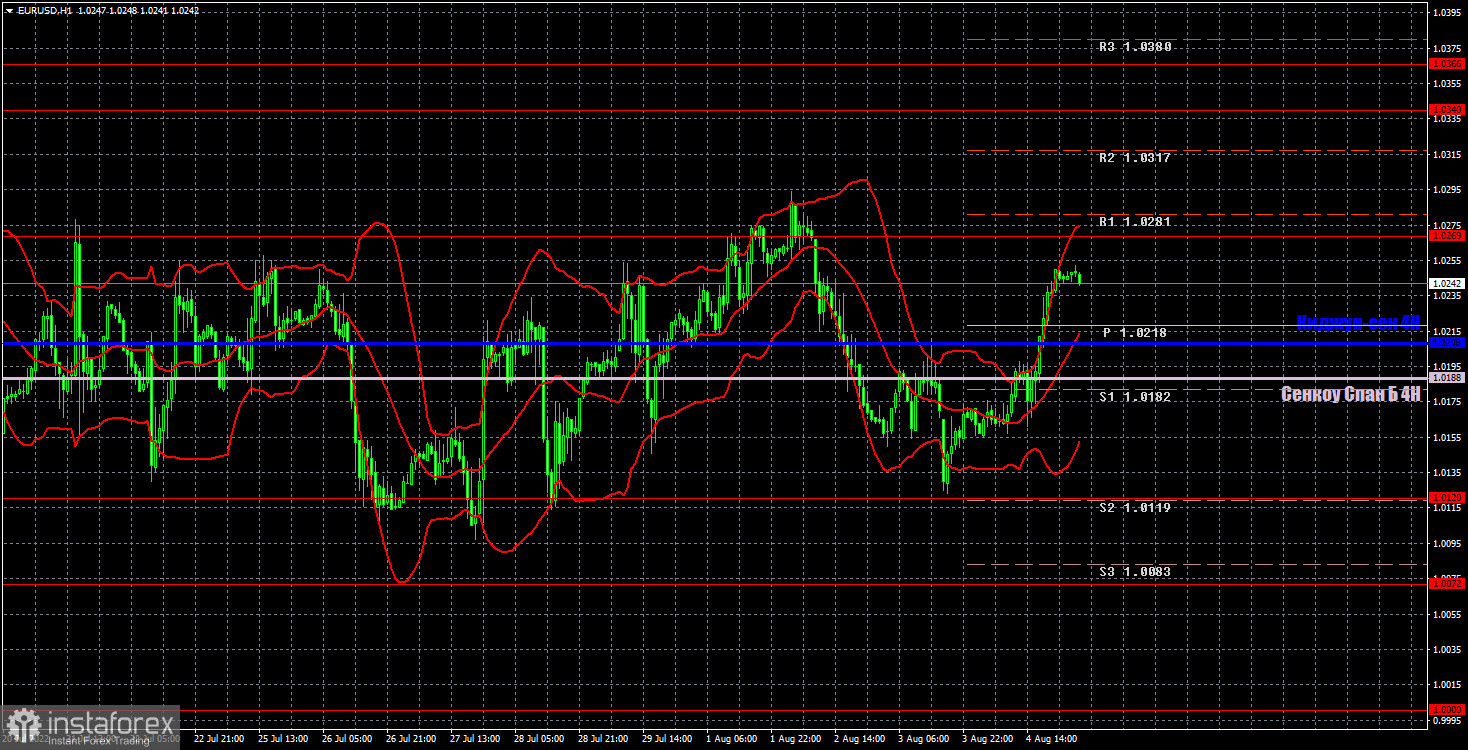
EUR/USD 1H
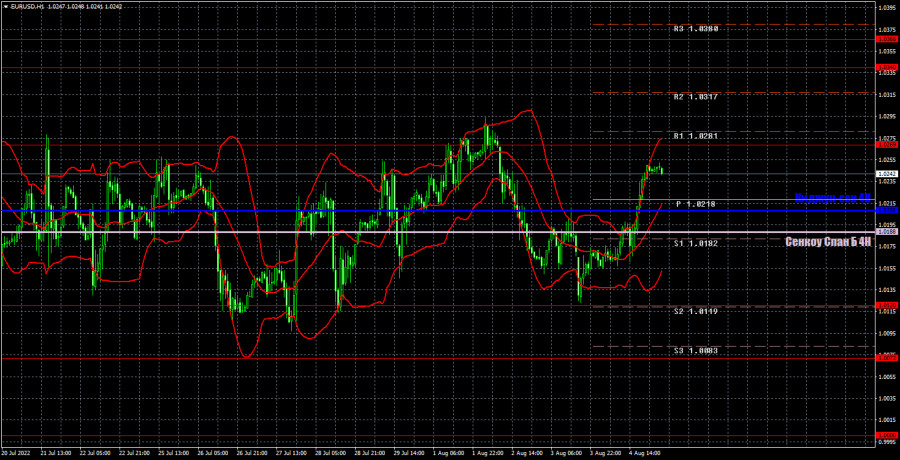
The pair continues to trade between the levels of 1.0120 and 1.0269 on the hourly timeframe. Thus, the flat remains and may continue for some time. Ichimoku indicator lines are not strong now. There are no changes in the technical picture now. We highlight the following levels for trading on Friday - 1.0000, 1.0072, 1.0120, 1.0269, 1.0340-1.0366, 1.0485, as well as Senkou Span B (1.0188) and Kijun-sen lines (1.0208). Ichimoku indicator lines can move during the day, which should be taken into account when determining trading signals. There are also secondary support and resistance levels, but no signals are formed near them. Signals can be "rebounds" and "breakthroughs" extreme levels and lines. Do not forget about placing a Stop Loss order at breakeven if the price has gone in the right direction for 15 points. This will protect you against possible losses if the signal turns out to be false. No important publications or other events are planned in the European Union on August 5, but the most important reports on unemployment and Nonfarm will be published in the United States. Thus, an attempt may be made to leave the horizontal channel tomorrow, but everything will depend on the nature of the NonFarm Payrolls report.
Explanations for the chart:
Support and Resistance Levels are the levels that serve as targets when buying or selling the pair. You can place Take Profit near these levels.
Kijun-sen and Senkou Span B lines are lines of the Ichimoku indicator transferred to the hourly timeframe from the 4-hour one.
Support and resistance areas are areas from which the price has repeatedly rebounded off.
Yellow lines are trend lines, trend channels and any other technical patterns.
Indicator 1 on the COT charts is the size of the net position of each category of traders.
Indicator 2 on the COT charts is the size of the net position for the non-commercial group.